SPM9613 Community Noise Prediction Software, Version 2
SPM9613 V2 is no longer being offered except in special requests. We hope to release an updated version in the future.
 Born from our years of estimating and predicting noise from industrial
noise sources, Power Acoustics, Inc. has developed and optimized a
low-cost computer program for analyzing community noise and sound
propagation emitted from a variety of noise sources. The engineering software
is based on the ISO 9613 parts 1 and 2 standards. SPM9613 provides
calculations at specific field points (listeners) and predictions of A-
and C-weighted sound level contours as well. We sell this
software as a low cost alternative to more expensive and difficult to
use computer programs.
Born from our years of estimating and predicting noise from industrial
noise sources, Power Acoustics, Inc. has developed and optimized a
low-cost computer program for analyzing community noise and sound
propagation emitted from a variety of noise sources. The engineering software
is based on the ISO 9613 parts 1 and 2 standards. SPM9613 provides
calculations at specific field points (listeners) and predictions of A-
and C-weighted sound level contours as well. We sell this
software as a low cost alternative to more expensive and difficult to
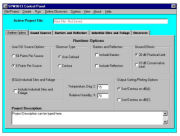
use computer programs. The original release of our community noise sound propagation model, SPM9613™ was in January 1999. Version 2 was released in February 2002. The software has a Windows based user interface and enables users to perform multi-source and distributed source predictions with barriers and reflective surfaces. Because the software is developed by a company that is also an end user, it is extremely flexible and easy to use.
SPM9613 Features and Extensions
- Fast setup and calculation times
- Automatic breakdown of large 3-D or line sources into multiple point sources
- Multiple barriers
- Reflections - automatic image sources
- Ground Attenuation with defined limits
- Miscellaneous Attenuation (Foliage, Industrial Sites)
- Graphical capability to assure correct user inputs
- Plan views of equipment, barriers, foliage or industrial sites, and observer locations
- Source sound power level spectrum plots and directivity plots (vertical and horizontal)
- Sorted sound source waterfall plots at each observer location
- Contour plotting of A or C weighted levels
- 3-D Ground Elevation plots
- Ground Hardness contours
- Extended Octave Band Center Frequency range - 16 to 8000 Hz
- Computation of C-weighted levels
- Source sorting on A or C-weighting
- Customizing services available
- MS Windows 95, 98, NT, 2000, XP, Vista, Windows 7 and 10 Compatible
All calculations, sound sources, barriers, ground elevations and observers are represented internally within SPM9613 in three dimensions (x, y, z coordinates). Graphical output is presented in plan views of the equipment and observers and with contour plots.
Click on links below for technical downloads of SPM9613
Download a Specification Sheet
Download a Technical User's Manual
SPM9613 V2 is no longer being offered except in special requests. We hope to release an updated version in the future.